
Listen to the Brief
Too Busy to Read? We’ve Got You.
Get this blog post’s insights delivered in a quick audio format — all in under 10 minutes.
This audio version covers: Where the Refinance Volume Actually Is: A State-by-State Pipeline Map for the June 2026 Quarter
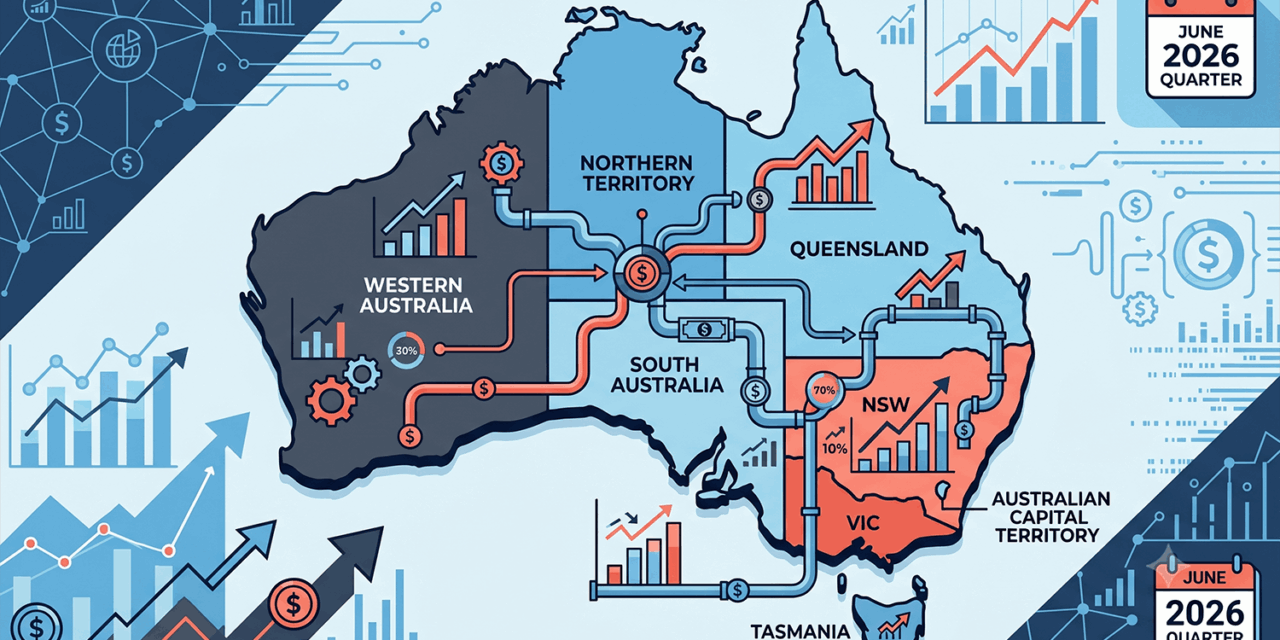
The Refinance Pipeline Map
Where the volume actually is — June 2026 quarter at a glance
Refinance submission growth by state (YoY)
What is driving it
Fixed-rate roll-offs
The biggest trigger. Loans reverting from “2-something” fixed to today’s variable = real payment shock.
4.35% cash rate
Keeps the gap between current and available rates wide enough to justify switch costs.
Equity unlock
Strong markets (incl. VIC & TAS) let clients consolidate, cash out or reprice LVR.
Cashback — fading
$2k–$4k offers from 2nd-tier/non-banks; many windows close mid-2026.
⚠ BID watch: cashback never drives the call
Under best interest duty, recommend on total cost, rate, fees, features and suitability. Treat any cashback as a bonus on an already-suitable product — and document that it did not lead the decision.
Your 5-step pipeline play
Mine your book first. Pull every fixed-rate expiry in the next 3–6 months. Sort by state.
Build a roll-off calendar. Reach out 8–12 weeks before each revert date.
Segment by driver. Rate-shock = repayment comparison. Equity = structuring chat.
Weight to the heat. Concentrate prospecting on VIC & TAS for a higher hit rate.
Lead with suitability. Total cost and fit first; cashback last and documented.
Where the Refinance Volume Actually Is: A State-by-State Pipeline Map for the June 2026 Quarter
The demand is real and growing. The trick this quarter is knowing exactly where it sits – and pointing your pipeline at it before the lender’s retention team does.
The refinance story is no longer a question of whether the volume is there. It is. The question for brokers heading into the back half of 2026 is sharper and more practical: where exactly is the demand concentrating, which clients in your own book are about to move, and how do you get in front of them first?
Across 2025, 640,137 mortgages were refinanced in Australia – roughly a 20% jump on the year before. The detail that matters most for brokers is buried in that number: 64% of those borrowers switched to a different lender. That is more than 409,000 loans that changed hands. Refinancing is not a defensive, stay-put exercise for most of these clients. It is a genuine market in motion, and broker channel is where a large share of it is initiated.
The momentum carried straight into 2026. The value of refinancing submissions flowing through broker networks rose 18.7% year-on-year in the March 2026 quarter. With the RBA cash rate at 4.35% and fixed-rate loans still rolling off onto higher revert rates, the pipeline has not dried up – it has simply changed shape.
The headline numbers, and why they matter to you
Three figures should sit on a sticky note above your desk this quarter.
640,137 refinances in 2025, up about 20%. The addressable market is large and growing, not shrinking. Even in a higher-rate environment, borrowers are actively shopping. The fear that “nobody refinances when rates are high” is not borne out by the data.
64% switched lender. This is the broker’s number. When two in three refinancers leave their original lender, that is exactly the moment a broker adds value – comparing across a panel, handling the discharge, managing the new application. Switchers need an intermediary; clients who simply ask their bank for a rate cut often do not. Your job is to find the switchers before they become passive stayers.
18.7% growth in broker submission value, March 2026 quarter. The channel is taking share and the deals are not small. This is current-quarter momentum, not a stale annual figure.
The state-by-state picture
Victoria and Tasmania are the standouts
Both recorded year-on-year increases of more than 28% in refinance submissions – well ahead of the national pace. If your book or marketing has any exposure to these two states, this is where your incremental effort should go first.
Victoria is the larger prize by sheer volume – the country’s second-biggest mortgage market, where a 28%-plus lift on that base represents a very large number of live opportunities. Many Victorian borrowers bought or last refinanced when fixed rates were briefly cheap, meaning their roll-offs are landing now.
Tasmania is the higher-percentage mover and a market brokers often under-service. Its smaller absolute size masks how much it is heating up in relative terms. A 28%-plus increase signals borrowers who have built equity through the state’s strong run and are now consolidating, restructuring, or chasing a better rate after a fixed term. Brokers with Tasmanian connections, or willing to service the state remotely, compete in a less crowded field.
For New South Wales and Queensland, the national trend still applies even where they are not leading the growth tables. NSW carries the biggest loan balances in the country, so even average-paced percentage growth means substantial dollar volume and fatter individual deals. Queensland’s continued population inflow keeps demand steady. WA, SA, the ACT and NT each have their own rhythm, but the engine – fixed-rate roll-offs meeting a 4.35% cash rate – is national.
The practical takeaway: do not treat your pipeline as one homogeneous pool. Segment it by state. If you market online or operate across borders, weight your prospecting toward Victoria and Tasmania this quarter, because that is demonstrably where the highest concentration of active refinancers sits right now.
What is driving the demand
Understanding the driver lets you speak to it in your outreach. The dominant force remains the fixed-rate roll-off. Borrowers who locked ultra-low fixed rates during the pandemic-era window have been rolling off in waves, and that cycle is not finished. When a loan reverts from a fixed rate starting with a 2 to a variable revert rate well above it, the repayment shock is the single most powerful trigger for action. These clients are not browsing – they are reacting to a concrete payment increase, which makes them the warmest leads in your database.
The 4.35% cash rate underpins everything, keeping the gap between a borrower’s current rate and a sharper available rate wide enough to justify switch costs. As long as that gap exists, the economics work – and 64% of borrowers are voting with their feet.
Equity is the quieter driver. Borrowers in markets that have run hard – including parts of Victoria and much of Tasmania – have built equity to consolidate debt, fund renovations, release cash, or move to a lower LVR band with better pricing. These are richer, stickier conversations where a broker’s structuring advice genuinely earns the relationship.
The cashback question – and your BID obligation
Second-tier and non-bank lenders have spent recent quarters dangling $2,000 to $4,000 cashback offers to win refinance business. Many of those windows are closing around mid-2026. Treat cashback as a fading lever, not a foundation. A client who switched for $3,000 will switch again the moment a bigger number appears elsewhere. That is churn, not a relationship.
More importantly, cashback sits squarely inside your best interest duty. Your recommendation must be driven by what is genuinely in the client’s interest – the true cost over time, the rate, fees, features, structure and suitability. A cashback can be a legitimate factor, but it must never be the factor that drives the recommendation. A $3,000 cashback on a loan that costs the client more over three years is not a good outcome.
The defensible approach: run the full comparison on the merits, arrive at the recommendation, then treat any cashback as a bonus on an already-suitable product – and document your reasoning so the file shows the cashback did not lead the decision.
How to target your pipeline this quarter
- Mine your own database first. Pull every client approaching a fixed-rate expiry in the next three to six months. These are your warmest opportunities – a concrete trigger date and an existing relationship. Sort by state and prioritise VIC and TAS.
- Build a roll-off calendar. Diarise outreach eight to twelve weeks ahead of each revert, so you compare, prepare and submit before the repayment shock hits.
- Segment outreach by driver. Rate-shock clients need a clear before-and-after repayment comparison. Equity-rich clients need a structuring conversation about consolidation, cash-out or LVR repricing.
- Weight geography toward the heat. Where you have flexibility in prospecting or advertising, concentrate it on Victoria and Tasmania for a higher hit rate per hour and per dollar.
- Lead with suitability, not cashback. Make total cost and fit the centre of every conversation. If a suitable product carries a cashback before its window closes, mention it as a bonus and document it correctly.
The bottom line
The volume is there and growing – 640,137 switches in 2025, broker submission values up 18.7% into March 2026, and a roll-off cycle still feeding the pipeline against a 4.35% cash rate. But it is concentrated, not uniform, and Victoria and Tasmania are where the heat is highest with 28%-plus YoY growth. Segment your book by state, roll-off date and driver, get in front of roll-offs early, and keep recommendations anchored to the client’s best interest – not a cashback that is about to disappear.
General information for mortgage broking professionals only; current as at 15 June 2026. Figures cited reflect industry refinancing data for 2025 and the March 2026 quarter and an RBA cash rate of 4.35%. Cashback offers, lender criteria and rates change without notice. This is not financial, legal or compliance advice – brokers must satisfy their own best interest duty and licensing obligations on every file.
Refinance Pipeline Prioritiser
Pick a client scenario and get a priority score, the demand signals to watch, and BID-safe talking points for the June 2026 quarter.
Demand signals for this segment
Talking points to open with
⚠ BID reminder
- Recommend on total cost, rate, fees, features and suitability — not the cash.
- $2k–$4k cashback offers are fading (many windows close mid-2026); treat any cashback as a bonus on an already-suitable product.
- Document that cashback did not drive the recommendation.
Indicative priority guide for broker planning only, current as at 15 June 2026. Not financial, credit or compliance advice. You must satisfy your own best interest duty on every file.
Disclaimer: This article is for general information and professional development purposes only. It does not constitute legal, compliance, or financial advice. Brokers should consult their aggregator’s compliance team and, where required, seek independent legal advice regarding their obligations under the National Consumer Credit Protection Act 2009 and ASIC’s responsible lending guidelines.

Listen to the Brief
Too Busy to Read? We’ve Got You.
Get this blog post’s insights delivered in a quick audio format — all in under 10 minutes.
This audio version covers: Where the Refinance Volume Actually Is: A State-by-State Pipeline Map for the June 2026 Quarter
The Refinance Pipeline Map
Where the volume actually is — June 2026 quarter at a glance
Refinance submission growth by state (YoY)
What is driving it
Fixed-rate roll-offs
The biggest trigger. Loans reverting from "2-something" fixed to today's variable = real payment shock.
4.35% cash rate
Keeps the gap between current and available rates wide enough to justify switch costs.
Equity unlock
Strong markets (incl. VIC & TAS) let clients consolidate, cash out or reprice LVR.
Cashback — fading
$2k–$4k offers from 2nd-tier/non-banks; many windows close mid-2026.
⚠ BID watch: cashback never drives the call
Under best interest duty, recommend on total cost, rate, fees, features and suitability. Treat any cashback as a bonus on an already-suitable product — and document that it did not lead the decision.
Your 5-step pipeline play
Mine your book first. Pull every fixed-rate expiry in the next 3–6 months. Sort by state.
Build a roll-off calendar. Reach out 8–12 weeks before each revert date.
Segment by driver. Rate-shock = repayment comparison. Equity = structuring chat.
Weight to the heat. Concentrate prospecting on VIC & TAS for a higher hit rate.
Lead with suitability. Total cost and fit first; cashback last and documented.
Where the Refinance Volume Actually Is: A State-by-State Pipeline Map for the June 2026 Quarter
The demand is real and growing. The trick this quarter is knowing exactly where it sits - and pointing your pipeline at it before the lender's retention team does.
The refinance story is no longer a question of whether the volume is there. It is. The question for brokers heading into the back half of 2026 is sharper and more practical: where exactly is the demand concentrating, which clients in your own book are about to move, and how do you get in front of them first?
Across 2025, 640,137 mortgages were refinanced in Australia - roughly a 20% jump on the year before. The detail that matters most for brokers is buried in that number: 64% of those borrowers switched to a different lender. That is more than 409,000 loans that changed hands. Refinancing is not a defensive, stay-put exercise for most of these clients. It is a genuine market in motion, and broker channel is where a large share of it is initiated.
The momentum carried straight into 2026. The value of refinancing submissions flowing through broker networks rose 18.7% year-on-year in the March 2026 quarter. With the RBA cash rate at 4.35% and fixed-rate loans still rolling off onto higher revert rates, the pipeline has not dried up - it has simply changed shape.
The headline numbers, and why they matter to you
Three figures should sit on a sticky note above your desk this quarter.
640,137 refinances in 2025, up about 20%. The addressable market is large and growing, not shrinking. Even in a higher-rate environment, borrowers are actively shopping. The fear that "nobody refinances when rates are high" is not borne out by the data.
64% switched lender. This is the broker's number. When two in three refinancers leave their original lender, that is exactly the moment a broker adds value - comparing across a panel, handling the discharge, managing the new application. Switchers need an intermediary; clients who simply ask their bank for a rate cut often do not. Your job is to find the switchers before they become passive stayers.
18.7% growth in broker submission value, March 2026 quarter. The channel is taking share and the deals are not small. This is current-quarter momentum, not a stale annual figure.
The state-by-state picture
Victoria and Tasmania are the standouts
Both recorded year-on-year increases of more than 28% in refinance submissions - well ahead of the national pace. If your book or marketing has any exposure to these two states, this is where your incremental effort should go first.
Victoria is the larger prize by sheer volume - the country's second-biggest mortgage market, where a 28%-plus lift on that base represents a very large number of live opportunities. Many Victorian borrowers bought or last refinanced when fixed rates were briefly cheap, meaning their roll-offs are landing now.
Tasmania is the higher-percentage mover and a market brokers often under-service. Its smaller absolute size masks how much it is heating up in relative terms. A 28%-plus increase signals borrowers who have built equity through the state's strong run and are now consolidating, restructuring, or chasing a better rate after a fixed term. Brokers with Tasmanian connections, or willing to service the state remotely, compete in a less crowded field.
For New South Wales and Queensland, the national trend still applies even where they are not leading the growth tables. NSW carries the biggest loan balances in the country, so even average-paced percentage growth means substantial dollar volume and fatter individual deals. Queensland's continued population inflow keeps demand steady. WA, SA, the ACT and NT each have their own rhythm, but the engine - fixed-rate roll-offs meeting a 4.35% cash rate - is national.
The practical takeaway: do not treat your pipeline as one homogeneous pool. Segment it by state. If you market online or operate across borders, weight your prospecting toward Victoria and Tasmania this quarter, because that is demonstrably where the highest concentration of active refinancers sits right now.
What is driving the demand
Understanding the driver lets you speak to it in your outreach. The dominant force remains the fixed-rate roll-off. Borrowers who locked ultra-low fixed rates during the pandemic-era window have been rolling off in waves, and that cycle is not finished. When a loan reverts from a fixed rate starting with a 2 to a variable revert rate well above it, the repayment shock is the single most powerful trigger for action. These clients are not browsing - they are reacting to a concrete payment increase, which makes them the warmest leads in your database.
The 4.35% cash rate underpins everything, keeping the gap between a borrower's current rate and a sharper available rate wide enough to justify switch costs. As long as that gap exists, the economics work - and 64% of borrowers are voting with their feet.
Equity is the quieter driver. Borrowers in markets that have run hard - including parts of Victoria and much of Tasmania - have built equity to consolidate debt, fund renovations, release cash, or move to a lower LVR band with better pricing. These are richer, stickier conversations where a broker's structuring advice genuinely earns the relationship.
The cashback question - and your BID obligation
Second-tier and non-bank lenders have spent recent quarters dangling $2,000 to $4,000 cashback offers to win refinance business. Many of those windows are closing around mid-2026. Treat cashback as a fading lever, not a foundation. A client who switched for $3,000 will switch again the moment a bigger number appears elsewhere. That is churn, not a relationship.
More importantly, cashback sits squarely inside your best interest duty. Your recommendation must be driven by what is genuinely in the client's interest - the true cost over time, the rate, fees, features, structure and suitability. A cashback can be a legitimate factor, but it must never be the factor that drives the recommendation. A $3,000 cashback on a loan that costs the client more over three years is not a good outcome.
The defensible approach: run the full comparison on the merits, arrive at the recommendation, then treat any cashback as a bonus on an already-suitable product - and document your reasoning so the file shows the cashback did not lead the decision.
How to target your pipeline this quarter
- Mine your own database first. Pull every client approaching a fixed-rate expiry in the next three to six months. These are your warmest opportunities - a concrete trigger date and an existing relationship. Sort by state and prioritise VIC and TAS.
- Build a roll-off calendar. Diarise outreach eight to twelve weeks ahead of each revert, so you compare, prepare and submit before the repayment shock hits.
- Segment outreach by driver. Rate-shock clients need a clear before-and-after repayment comparison. Equity-rich clients need a structuring conversation about consolidation, cash-out or LVR repricing.
- Weight geography toward the heat. Where you have flexibility in prospecting or advertising, concentrate it on Victoria and Tasmania for a higher hit rate per hour and per dollar.
- Lead with suitability, not cashback. Make total cost and fit the centre of every conversation. If a suitable product carries a cashback before its window closes, mention it as a bonus and document it correctly.
The bottom line
The volume is there and growing - 640,137 switches in 2025, broker submission values up 18.7% into March 2026, and a roll-off cycle still feeding the pipeline against a 4.35% cash rate. But it is concentrated, not uniform, and Victoria and Tasmania are where the heat is highest with 28%-plus YoY growth. Segment your book by state, roll-off date and driver, get in front of roll-offs early, and keep recommendations anchored to the client's best interest - not a cashback that is about to disappear.
General information for mortgage broking professionals only; current as at 15 June 2026. Figures cited reflect industry refinancing data for 2025 and the March 2026 quarter and an RBA cash rate of 4.35%. Cashback offers, lender criteria and rates change without notice. This is not financial, legal or compliance advice - brokers must satisfy their own best interest duty and licensing obligations on every file.
Refinance Pipeline Prioritiser
Pick a client scenario and get a priority score, the demand signals to watch, and BID-safe talking points for the June 2026 quarter.
Demand signals for this segment
Talking points to open with
⚠ BID reminder
- Recommend on total cost, rate, fees, features and suitability — not the cash.
- $2k–$4k cashback offers are fading (many windows close mid-2026); treat any cashback as a bonus on an already-suitable product.
- Document that cashback did not drive the recommendation.
Indicative priority guide for broker planning only, current as at 15 June 2026. Not financial, credit or compliance advice. You must satisfy your own best interest duty on every file.
Disclaimer: This article is for general information and professional development purposes only. It does not constitute legal, compliance, or financial advice. Brokers should consult their aggregator’s compliance team and, where required, seek independent legal advice regarding their obligations under the National Consumer Credit Protection Act 2009 and ASIC’s responsible lending guidelines.

